
Are Oil and Oil Spreads About to Soar to New Highs?
- bkkelly6
- Mar 7, 2021
- 7 min read
Author: Brynne Kelly 3/07/2021
Are calendar spreads about to soar to new highs and establish a new base-trading range?
The crude oil complex is operating under a bullish perceived bias that a short-term supply imbalance is imminent. Last week the market received some significant and tangible data about the current state of affairs. These include:
OPEC+’s decision: Leave production unchanged (but for a concession of 130,000 bpd for Russia and 20,000 bpd for Kazakhstan). In addition, Saudi Arabia stated that they will continue with their 1mbpd unilateral production cuts.
Canadian Production: Adding insult to injury, last week it was announced that maintenance at three oil sands upgraders in Canada will take about 500,000 bpd in production offline. According to Bloomberg reports, Canadian Natural Resources, Suncor Energy, and Syncrude will all idle upgraders, resulting in a 500,000 bpd decrease in distilled oil supply.
Inventory: US EIA Inventory data for the week-ending 2/26/21 showed record gains in oil inventories offset by even more record-breaking draws from clean products inventories (gasoline and distillate)
The individual magnitude of each item above is significant. Taken as a whole, the market appeared to absorb the information as fuel in preparation for another rally. Prior to last week, calendar spreads had rallied to new 12 month highs and had begun to establish a new trading range. We observe this below via a chart of the ever-popular Jun-21/Dec-21 calendar spread. By last Friday, the spread once again made new highs and closed out the week at a whopping $4.23 backwardation.

At this point, the spread level becomes nothing more than a number - an instrument the market is using to express and gauge bullish sentiment. Continued strength represents nothing more than the market's desire to hold exposure to short-term fundamentals relative to long-term fundamentals. And why not? Current operating conditions across the industry are certainly more vulnerable than they have been in a long time. Demand destruction and weather have done a number on producers and refiners in the past year. As a result, there is a reluctance to trust what they are seeing in the market. Is making a barrel today worth much more than a barrel in the future?
What's ironic though is that as recent as last year, the primary focus in the market was tied to the swift move lower of oil prices, which led to a rapid flip of calendar spreads from backwardation into severe contango. Toward that end, spreads were now in search of the 'right' level of contango structure to accurately reflect how loose demand was relative to supply. As the months progressed, it became apparent that production cuts across the globe were having their intended impact to global inventories, which had begun to slowly decline. Calendar spreads responded by strengthening, until one-by-one they flipped into backwardation.

The proclivity of the market to prefer a barrel delivered today vs one in the future continues. Still we note that with each passing month we have been seeing the front spread in WTI collapse under the pressure of the monthly futures roll and contract expiration. This has yet to impact overall optimism as traders simply move on to the next spread further out on the curve in an attempt to try to pinpoint the exact month the market will flip into an actual supply deficit. Looking at the 1-month calendar spread curve in WTI, as of last Friday's close, the Aug-21/Sep-21 spread currently holds the honor of the highest 1-month WTI calendar spread on the board at $0.77/bbl (gold line below).

For some perspective on that $0.77 spread level, we glance at some recent history of both the front spread and the one-month spread 5 months out on a rolling basis (black and pink lines below, respectively). There are only 2 time periods, historically, where the front-month calendar spread broke above the $1.00 level

Outright Prices
On a rolling basis, front-month futures have not made a new high since early 2018. Squeezing above resistance here could open the door to the $75-$100/bbl range.
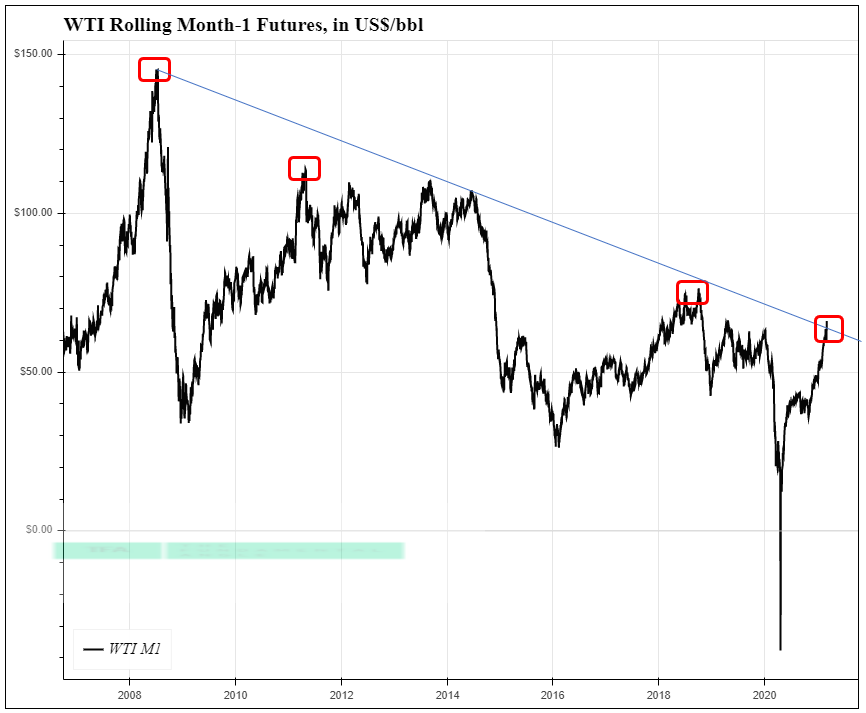
Do we have the fundamental underpinnings needed to sustain a move higher from here? Or have prices completely disconnected from the underlying fundamental data? To observe this we compare the rolling 12-month WTI futures strip to the following fundamental data points:
Supply: US Weekly EIA Crude Oil Supply (production plus net imports)
Demand: US Weekly EIA Crude Oil Input to Refiners
Inventory: US weekly EIA Commercial Crude Oil Inventory
SUPPLY
On a macro level, US supplies of crude oil (production plus net imports, blue line below) have been on the decline since 2019. The fact that they continue to remain at reduced levels while demand is rising has pushed 1-year WTI strip prices well above the $60 level. The market continues higher in the face of the very real possibility that supply has no where to go but up from here.

Over the last year, 12-month prices have gone to hell and back. At some point along the way, we expect that producers have hedged. This is relevant because prices are now blowing through prior year levels. Upside calls were no doubt sold against future production during this time period and could be a tailwind on price rallies in 2021. Has the upside already been given away?

DEMAND
Along with the decline in US supply, there has also been a decline in the demand of crude oil by refiners (blue line below). Even OPEC+ has been reticent to solidify a plan of production increases going forward. US refiner inputs have been on a general decline since the latter half of 2018, registering lower weekly highs ever since. Concurrently, the rolling 12-month strip price peaked at around the same time at just over $70/bbl (black line below). This continued even though US refiner throughput reached an all-time low according to last week's EIA data (blue dot below). The belief is that this latest drop in refinery utilization is specifically storm-related and will be short-lived, and the amount of potential crude oil demand is out there once refiners return to normal operations.

INVENTORY
We know that the abrupt drop in refinery throughput last year led to one of the largest and swiftest increases in oil stockpiles in history. Production restraint by OPEC+ and other producers also allowed excess US crude oil inventories to vanish almost completely prior to the storm-related operational issues last week (blue line below, US commercial crude oil inventory). Looking at historical data points of inventory levels vs 12-month strip pricing, we note that market is eager to look beyond the large build in oil inventories last week and consider it an anomaly since the 12-month strip continued to rally despite last week's crude oil build. The expectation is that once refiners resume operations, crude oil markets will be tight and inventory will continue to be drawn down. The onus will be on future inventory reports to validate whether or not this is true.

In addition to the the data points above, Saudi Arabia’s state oil producer Aramco set its April official selling price (OSP) for its Arab Light crude to Asia at plus $1.40 per barrel versus the Oman/Dubai average. This is up $0.40 from March, according to a statement issued on Sunday.
Of the 3 main comparisons (Supply, Demand & Inventory) to strip prices above, only the production trend seems to be registering with the trend in outright prices. Current inventory levels and reduced refinery runs do not appear to be hampering future expectations. The current rally speaks volumes towards this. Today's operating conditions are expected to change significantly going forward. The strip price proves the market is willing to overlook where things ARE and focus on where things are HEADED.
Where are things headed?
Summer driving season is fast approaching. It's reasonable to expect that the relaxation of virus-related restrictions will continue as we move into summer, increasing the demand for refined products. As it stands now, both gasoline and distillate inventories are below their 5-year average. Inventory has typically provided us with a buffer as we move forward. As long as there is excess inventory, mismatches in the timing of supply vs demand of refined products can be minimized.

As of last week, both US gasoline and US distillate inventory suggest the possibility of concern if the pace of last week's draws continue. And, of course, the reason the US has continued to draw down refined product inventories is due to economic restraint by refiners to reduce throughput. The total gasoline and distillate supplied by refiners are now each below their 5-year historical average.

The irony is that 'Product Supplied by Refiners' has often been used as a proxy for end-user demand. This proxy becomes less useful taken alone when there are large weekly changes to product inventories. What is crystal clear though is that the refining community cannot meet local demand at the reduced throughput levels seen last week (hence the large draw in product inventories).
Refiner output needs to, and will, increase. A surge in refinery throughput will put a bid in oil markets regardless of where outright prices are, as long as refining margins hang tough. The revival of summer-2021 crack spreads above pre-pandemic levels is encouraging (green line below). The concern is that an increase in gasoline output leads to an increase in ULSD output and therefore depresses summer ULSD cracks further (blue line below). We think that refiners will be more than happy to increase runs even with the slightest of margins. As long as crack spreads don't collapse, oil production can increase and prices can go higher.

Backwardation in spreads isn't relegated to only crude oil markets. Front month spreads have been rallying across the board, with distillate spreads currently the weak link. ULSD going forward will need to contend with seasonal summer builds in inventory. This is seasonally expected and distillate markets have been known to enter a contango structure in order to entice summer inventory builds ahead of winter weather.

This is insanely evident when looking at the widening spread between 'summer' and 'winter' ULSD cracks to WTI. This gap reflects the current market predicament. Demand is expected to increase, but providing too large of an incentive to store barrels can lead to a more problematic situation in the future. Watch summer vs winter distillate spreads (dark blue line vs light blue line) as a signal. A widening spread could be a sign that the market is kicking the can down the road in hopes of a weather savior next year. Building too much distillate inventory in the summer could put a cap on futures oil price rallies in the future.

Watch spreads going forward if you are looking to build conviction on either side of the fence. Front month cash spreads in oil are going to need to validate the big levels in future calendar spreads. Along with that, increased refinery output needs to be met with resilience in crack spreads. Cutting off the hand to spite the first isn't an old adage for nothing.
Calendar spreads have been signaling bullish market expectations for a while. The move they implied is finally being realized. Outright prices have made new highs. Are we at the beginning of a profoundly bullish market prescribed by spreads, or have we peaked absent new data?
_________________________________________________________________________________
EIA Inventory Statistics Recap
Weekly Changes
The EIA reported a total petroleum inventory DRAW of 1.70 million barrels for the week ending February 26, 2021 (vs a draw of 3.70 million barrels last week).

YTD Changes
Year-to-date total inventories in 2021 are DOWN by 14.10 million barrels. An unprecedented decline for this time of year.

Inventory Levels
Commercial Inventory levels of Crude Oil (ex-SPR) compared to prior years continue to show signs of recovery.

Comments