
Don't Call it a Comeback.....Yet
- bkkelly6
- Feb 7, 2021
- 5 min read
Author: Brynne Kelly
Crude oil futures continue to rally. Front-month Brent futures are fast approaching $60 with WTI not far behind at just above $57. Backwardation continues to strengthen along the curve. Shifts in WTI crude oil curves are weighted towards the front of the market. This is clearly observed when looking at the shift in the WTI futures curves for calendar 2022 through 2026 (left chart below) and on a 36-month rolling basis (right chart below).

What this tells us is that the front of the market has done a great job lifting the entire complex higher this year. But, before claiming victory or calling it a comeback, we add to the above charts the curves as of January, 2020. This clearly highlights that on an outright basis, the back of the oil curve still bears the battle-scars of 2020.

Production cuts are doing their job and seem to have sufficiently firmed-up the supply demand balance in the short-term. But, there is something interesting to note here. Calendar spreads are teetering at levels that imply we are so tight that we are merely one event away from an upside spike in prices. This level of backwardation usually appears when the market fears a supply shock (2018=hurricanes, 2019=Saudi drone strike).

Is this warranted? How do we frame the supply shock being anticipated today? For sure it has a different nuance to it than it has in the past. Yet, backwardation in recent history has been facilitated by supply cuts. OPEC+ has been instituting some form of supply cuts since 2017. Since the US shale boom, OPEC+ has had to implement supply cuts to balance the market. Beginning with a 1.2 million barrel/day cut in late 2016 and culminating with an historic 9.7 million barrel/day cut in April, 2020.
Supply cuts tend to have the largest impact in summer/fall months when oil production is vulnerable to storm-induced production declines. This above chart highlights this. Accordingly, we see the current month-7 vs month-12 spread outperforming the front 6-month spread (month-1 vs month-6, black line above). The deferred 6-month spread (green line above) is suggesting that the market expects an event that eventually catapults the front 6-month spread. In that way, the market wants to 'buy and hold' the deferred 6-month spread to capture an eventual blowout.
The market is patient, but thirsty for 'THE' event that breaks the back of the supply/demand balance and rallies short-term prices more than longer-dated prices. In the short-term, the market has depreciated the 'call' on production. The market is saying that it believes that there is greater risk that demand will recover faster than supply can react in the system OR that supply will not be able to react to normal seasonal factors that disrupt supply.
This narrative can buoy the market as long as production and inventory statistics cooperate. The trajectory of US EIA inventory data have been supportive this year (commercial crude oil inventory left, Cushing crude oil inventory right below). Commercial inventories are not growing, and Cushing inventory levels are declining. However, both remain above last year levels for this time of year.

As long as inventory levels or trends in inventory levels aren't an anomaly, they are largely ignored. As long as inventory levels are following seasonal trends, the market can put them aside and focus on other disrupters. Inventory can take a back seat to things like interest rates, foreign exchange rates, equity market sentiment and traditional spread relationships.
The same applies to refined product inventories. While both remain elevated, neither are at all-time highs. All eyes will not be watching to see if seasonal trends materialize regardless of outright levels.

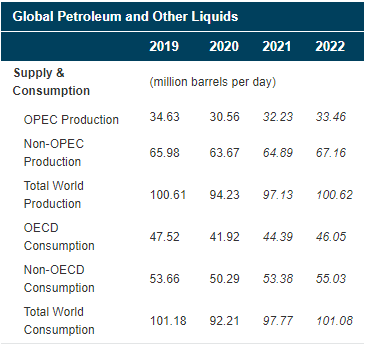
According to the EIA (as of January 12, 2021), consumption of global petroleum and liquids is forecast to average around 98 million barrels per day in 2021. This is not to be minimized against the backdrop of global climate objectives. The desired future state of the energy production mix has some serious hurdles to overcome. The first being the amount of petroleum and other liquids currently consumed.
Beyond 2021, consumption is projected to increase. There is not enough viable current production of renewable fuels, or growth in renewable fuels production, to step in and meaningfully replace the energy required to fuel the world. The bridge between the two (traditional fuel production and renewable fuel targets) is being met by the RIN market (discussed in previous reports). The RIN market enables current production via a 'penalty', or an accounting adjustment. Given enthusiastic global climate objectives there are few ways to meet 'carbon-neutral' objectives without RIN's. Meaning that the price of 'renewable offsets' will most likely grow faster than the actual production of renewable fuel.
Climate objectives are definitely changing the landscape under which traditional fuels can be produced, but this is being done largely under a backdrop of slow renewable output growth. This is due to the fact that without tax incentives, renewable fuel production remains uneconomic or at a minimum is not compelling enough to throw the baby out with the bathwater.
For example, the RIN credit generated by the production of biodiesel (D4 RIN, pink line below) is less than the spread between soybean oil and heating oil (black and grey lines below). Once the additional $1.00 biofuel tax credit is added however, producing biofuel becomes more profitable than producing heating oil. The bean oil/heating oil spread (BOHO) represents the differential between soybean oil and heating oil futures and is used to gauge the practicability of discretionary biodiesel blending. In other words, it reflects blending economics. The higher the spread climbs, the more expensive it becomes to produce biodiesel.

A biodiesel blender that is registered with the Internal Revenue Service (IRS) may be eligible for a tax incentive (Biofuel Tax Credit, BTC) in the amount of $1.00 per gallon of pure biodiesel, agri-biodiesel, or renewable diesel blended with petroleum diesel to produce a mixture containing at least 0.1% diesel fuel. Only blenders that have produced and sold or used the qualified biodiesel mixture as a fuel in their trade or business are eligible for the tax credit. The incentive must first be taken as a credit against the blender's fuel tax liability; any excess over this tax liability may be claimed as a direct payment from the IRS.
In the simplest terms, the BTC makes the biofuel more price competitive with conventional diesel.
How long can this dynamic continue? Tax credits are currently in place to incentivize the production of renewable fuels. BUT, current legal specifications for on-road diesel don't allow for more than 10% of biodiesel blending.
All of this highlights the crack in overall market sentiment (ESG, climate objectives) vs the reality of producing fuel to meet current demand. We think this is the looming supply disruption noted earlier. The market believes there is a lack of interest in the production of traditional fuels due to stated climate objectives across the world. The market believes that it will take more than backwardation to entice long-term capital commitments towards the production of traditional fuels.
Finally, we circle back to calendar spreads. Having put inventory and renewable aspirations into perspective. Rolling 1-month calendar spreads (left chart below) have entered bullish territory. Territory generally observed when outright oil prices are at higher levels than they are today (right chart below).

There is a case to be made for higher oil prices. Current spread levels are more reflective of WTI oil prices in the $56-$68 range. Perhaps it's time for outright prices to take the lead now and backwardation to lag. The comeback story cannot be written by spikes in front-month prices alone.
_________________________________________________________________________________
EIA Inventory Statistics Recap
Weekly Changes
The EIA reported a total petroleum inventory BUILD of 3.50 million barrels for the week ending January 29, 2021 (compared with a build of 4.50 million barrels last week).

YTD Changes
Year-to-date total inventory changes for 2021 stand at 5.70 million barrels (vs 2.20 million barrels last week), with crude oil inventory now down 9.80 million barrels for the year.

Inventory Levels
Commercial Inventory levels of Crude Oil (ex-SPR) compared to prior years continue to show signs of recovery.

Comments