
Mid Year Recap: Have Markets Already Acknowledged What's To Come?
- bkkelly6
- Jun 27, 2021
- 7 min read
Author: Brynne Kelly 6/27/2021
This week we will officially close out the first half of 2021 as we head in to the long 4th of July holiday weekend in the US. The first 6 months of 2021 in the oil complex were marked by some key events:
Front-Month WTI Prices Move Above the $60-level
RIN Prices Reach All-Time Highs
Winter Storm Uri Wreaks Havoc on Texas and the Southeast
Suez Canal Blockage Disrupts Global Crude Oil Shipments
Colonial Pipeline Hack Forces Operator to Halt Operations
Demand Recovery Takes Hold as Lockdowns Ease
And If that weren't enough, the U.S. Supreme Court ruled on Friday to restore small refiners' exemptions from federal renewable fuel blending requirements, wiping out a Tenth Circuit ruling that eliminated the exemptions. The new precedent will give future administrations wide clearance to exempt oil refineries from annual blending quotas. In addition, next week OPEC+ members will meet (on July 1), with analysts expecting the producer group to raise production. At this point, anything less than 500Mbbls/d from OPEC+ would likely be viewed as bullish and see the market move higher in the near term.
FOR REFERENCE (per Bloomberg): Between May and July, OPEC+ agreed to return 2.1 MMbbls/d of supply. This includes Saudi Arabia ending the additional 1MMbbls/d of voluntary cuts it has made since February. It was agreed supply could increase in May, June and July by 600Mbbls/d, 700Mbbls/d and 840Mbbls/d respectively. However, due to some involuntary reductions, OPEC members fell short of the agreed supply increase in May. Under the deal, OPEC members could have increased supply by 527 Mbbls/d in May, however, supply from them only grew by 390 Mbbls/d MoM. By the end of July, the group will still have 5.8 MMbbls/d of supply to bring back to the market. The key question is how quickly this supply returns.
In plain English, the events of the last 12 months have led to some of the most significant price volatility in crude oil markets in modern times.
This week, we recap the market moves of the first half of 2021.
In a previous report we noted that it's as if we have hit the reset button and the price action of 2020 is nothing more than an anomaly, and we are simply going to pick up where we left off before the pandemic ever happened. In addition, we ask the question as to whether the first-half 2021 narrative has essentially played itself out.
FIRST HALF 2021 MARKET MOVES
Outright Prices
Outright crude oil prices have made an astonishing comeback in 2021. Not only have prices erased the bearish price action seen last year, but are now testing upside highs not seen since the US eliminated it's crude oil export ban. In fact, given the relentless move higher in oil futures, it seems hard to fathom that less than 6 months ago the 3-year continuous WTI strip was comfortably below $50 (red line vs green line below).

The continuous 3-year strip has catapulted higher since the beginning of the year, with outright prices almost $26 higher than where they were in January. The follow-on response from 1-month calendar spreads was close to a $1.00/bbl rally in front-month calendar spreads (green line vs red line below).

What lingers in people's minds when they view the above charts is the enormity of the rally we have experienced since the lows made in mid-2020. BUT, the fundamental conditions of a pandemic-laden 2020 no longer exist. Don't let 2020 be your mental screensaver as you view 2021, clear your mind of those cobwebs and start framing today's price levels in light of today's production cuts. Regardless of the timeline OPEC uses as a guide to return oil production to market, the effects of a global pandemic are unlikely to ever impact prices in the same way again. Global economies are open and comparisons to the events of 2020 are becoming a chart anomaly. In fact, the capital destruction done to the oil markets in 2020 is now believed to be nothing more than the underpinnings to the next great rally cycle in oil. 2021 actually has been the poster child of continual upward revisions in oil price - pushing front-month prices above their 10-year average (ex-2020) for this time of year.

Money has been pouring in for reflation trades, causing many input commodities to reach multi-year highs. However, we implore people to contemplate whether the growth narrative has already played out in futures markets, given the moves in prices this year.
Why do we suggest pause? Because the front of the market is becoming untethered from the back of the market at levels that, historically, have been untenable.
Calendar Spreads
One of the fundamental underpinnings of commodity markets is storage and it's impact on the structure of the futures curve. A market that is in normal contango suggests, at a minimum, that the complex is not only willing and able to absorb the costs of production but also values future production. A market that is in normal backwardation suggests that there is short-term demand or logistical issues that aren't expected to continue in the future. These are the base assumptions of commodity markets. Spreads that are outside the normal levels of backwardation or contango are the result of a more significant short-term problem.
With that concept in mind, we look at the progression of year-on-year calendar spreads over time. It comes as no surprise that 12- month spreads went in to super contango last year. But, they have recovered and are now close to historical high levels.

How should this be interpreted? First and foremost we think it reflects the historic amount of oil production being withheld by OPEC+. Second, it reflects the market belief that oil demand has reached it's peak. This is a duplicity that has led the front of the market to disconnect from the back. There is nothing wrong with this as long as OPEC+ increases production at a slower pace than demand recovers. As mentioned earlier, anything less than a 500MMbpd increase in OPEC+ production at this week's meeting will further exacerbate the disconnect of prompt markets from term markets.
This seems to be where we reside. A market that awaits a production increase. Without clarity on that point, calendar spreads (aka backwardation), continue to surpass expectations. Despite the weak expiration of front-month spreads in WTI, future spreads continue to price in a supply/demand mismatch. It is precisely this strength in calendar spreads that has kept outright prices from selling off.
In fact, regardless of how relatively weak the cash roll is in WTI, calendar spreads have maintained their 3Q bullish sentiment. This is incredibly clear when viewed through the lens of continuous 1-month calendar spreads (yellow line vs red line below). The market continues to put it's faith in a front-month supply crunch instigated by a lag in OPEC supply growth. But, it's important to note how significant this narrative has become. This strength can be seen via the shift in 1-month calendar spread futures below.

What happens once the front of the curve no longer reflects the uncertainty of the supply/demand imbalance? What happens once we reach equilibrium? Without the fear in front spreads, can outright prices continue to move higher?
The market narrative for oil is laden with bullish narratives for outright prices. The funny thing is that outright prices are already AT the targets posed by notable research firms. From here there are only a couple of paths: either the front of the market stalls while the back of the market catches up OR the front of the market collapses on the back.
One simple way to view this paradox is to look at the front 6 month calendar spread vs the second 6-month calendar spread (aka, the ever-popular Dec-June-Dec condor spread in WTI). A condor is simply one calendar spread vs another. In this case is is the Dec/June spread vs the following June/Dec spread (aka the ZMZ condor).
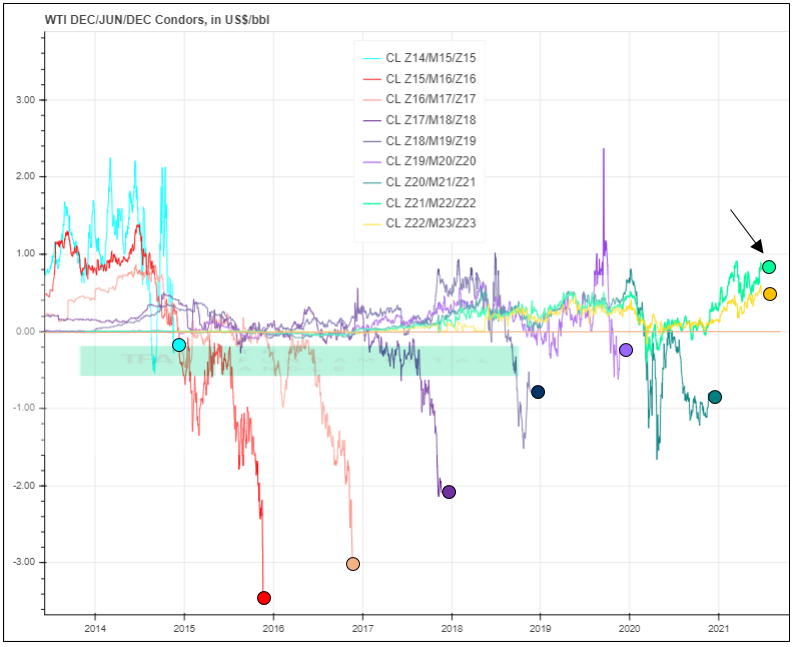
This chart highlights how front-led the sentiment is in oil markets. Despite the fact that since (at least) 2014, the front 6-month calendar spread has been unable to expire at a premium to the second 6-month spread (hence a negative ZMZ condor expiration), the condor is trading in backwardation for the next 2 calendar years (2021 & 2022).
There is nothing else to conclude here other than the fact that we have manufactured a short-term supply issue. We say 'manufactured' because the front spread has yet to realize it's bullish intentions.
There is one thing left to negate the perceived fragile structure in calendar spreads. That being refined product spreads.
Crack Spreads
All eyes continue to be on gasoline markets, despite the fact that there is nothing particularly notable about gasoline crack spreads historically.
According to the EIA, this year's summer gasoline demand is expected to hit 8.8 million barrels per day, up 13.2 percent from 7.8 million barrels per day in the summer of 2020. Still, that forecasted number is down 7 percent compared to the summer of 2019. This summer's gasoline demand is expected to peak in August at 9.1 million barrels per day. By comparison, demand in August 2019 was 9.9 million barrels per day and demand in August 2020 was 8.5 million barrels per day.
Yet in recent history (once IMO 2020 took effect), US distillate crack spreads to WTI outperformed RB gasoline crack spreads. This is something the market appears not ready to deal with. The market is still hanging it's hat on "the demand recovery and it's impact on gasoline inventory".

Simply put though, as summer reaches it's 'peak', it might be time for US distillate cracks/prices to take the lead.

As we move into the second half of 2021, its important to remember that the events that shaped the first half of 2021 are finite and can only carry us so far.
_________________________________________________________________________________
EIA Inventory Statistics Recap
Weekly Changes
The EIA reported a total petroleum inventory DRAW of 10.70 million barrels for the week ending June 18, 2021 (vs a build of 7.20 million barrels last week).

YTD Changes
Year-to-date cumulative changes in inventory for 2021 are DOWN by 62.20 million barrels (vs down 51.50 million last week).

Inventory Levels
Commercial Inventory levels of Crude Oil (ex-SPR) compared to prior years are no longer at excess levels and should continue to draw as long as backwardation in the market persists.

Comments