
The Back of the Curve is Leading Us Higher
- bkkelly6
- Apr 18, 2021
- 6 min read
Author: Brynne Kelly 4/16/2021
The back of the oil complex refuses to give up any ground. Last week the calendar 2022 strip in WTI hit a new high of $58.73 (on 4/14) before closing out the week slightly lower at $58.25 (green line below). This a long way from year-ago levels when the strip was hovering just above the $35 mark. In total, the curve spent about 10-months below the $50 level. Prior to the pandemic, dips in the front of the market below the $50 level weren't as catastrophic to the overall curve, short term oversupply conditions didn't always pull the back of the market down with it.

Once the pandemic hit one of the more bearish themes to roll across the oil complex was when the back curve was pulled down with the front of the market to levels that were unsustainable for the industry as a whole. The selloff in longer-dated prices wreaked havoc on the E&P sector and led to a serious decline in rig counts in the US. Since then, there has been a significant recovery across the entire curve, as shown in the 36-Month continuous futures curve below (red line vs gold line). What's been interesting to note, however, is the lack of selling pressure on the market once the back half of the curve crossed above the $50 level.

Mean Reversion
Despite the chaos of last year when front month futures experienced an epic selloff, the amount of time the entire curve spent dramatically below the $40 level was fairly minimal.
On a rolling basis, the front 12-month calendar strip close out the week at $61.45 (blue line below). Front month futures regained the $50 level in early 2021, and once the back of the curve followed, flat price was off to the races. The mean reversion within the $40-$60 range appears to be complete. Looking ahead we could see this move above $60 as an overshoot to the upside similar to the huge move below $40 last year.

For all the consternation that last year's selloff created, it's interesting to note the lack of selling activity by producers in the back of the curve above $50 (calendar 2022-2026 below).
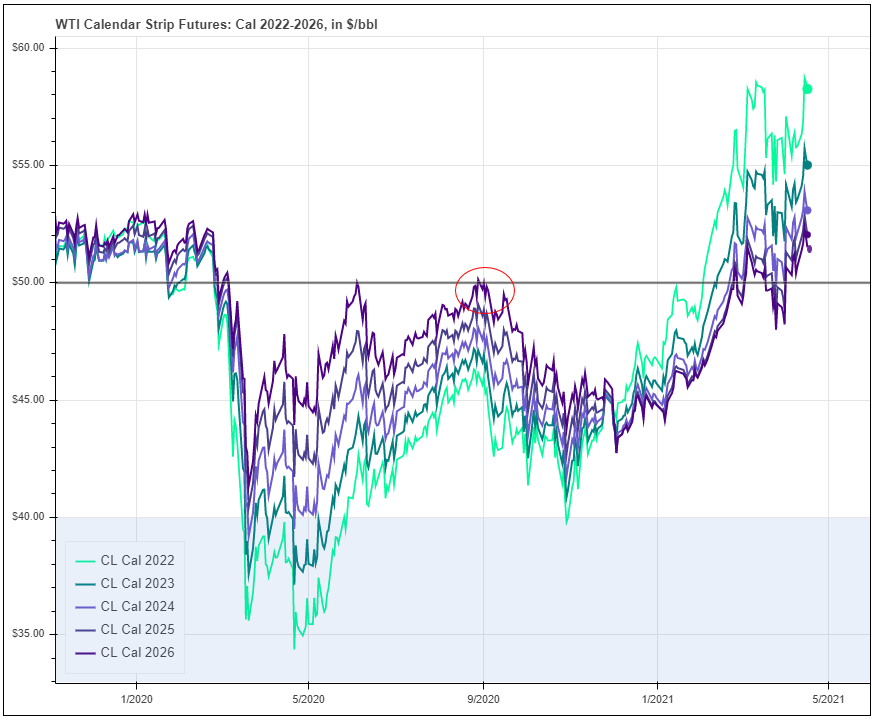
A lack of selling in the back of the curve takes the pressure off of the front of the market. For example (as shown above) last fall when the calendar 2025 and 2026 strips approached the $50 level the market quickly rejected it and tried to retest the April, 2020 lows. It wasn't until calendar 2022 stabilized around the $45 level and the curve structure flipped into backwardation, that WTI had the green light to rally. The fear that rising prices would lead to a boon of producer selling in the back of the curve seems to be held at bay for now.
Weakness in Prompt Calendar Spread
A thorn in the side of the most recent rally has been the inability of curve backwardation to realize at expiration. Charting front month futures against the front month calendar spread on a rolling basis highlights this phenomenon (blue line vs black line below). The bullish intermediate supply/demand forecasts are being expressed not only through outright prices but also through calendar spreads.

Specifically, since the beginning of April, the front calendar spread has stalled and reverted to a contango structure. Prior to that it had attempted to move into backwardation several times to no real avail. Even as outright prices staged a big rally last week, the front spread stayed weak.
Part of this can be attributed to the strong 'roll pressure' from managed funds that takes place from the 5th to 9th business day each month. This is a time when firms roll their exposure from the front contract to the next contract in anticipation of futures expiration. We see this action repeated over and over again each month in the chart below of CME WTI open interest by futures month. May-21 WTI expires on April 20th and accordingly, most of the volume has been 'rolled' to the June-21 contract (red vs purple line below). We now have until May 7 until the roll out of the June-21 contract begins.

These should be interesting times ahead as June is a popular spread month (expressed via the June/Dec calendar spread, a popular way to express not only summer vs winter but also bull/bear sentiment on the market as a whole). Now that June-21 is about to be the front contract on the board the weakness in the front of the curve is finally permeating into the June/Dec spread. All year long there has been a tremendous amount of bull/bear positioning around the summer vs next winter spread. Weakness in the front spread could prove problematic for the June/Dec spread as we head into the next roll period. Some are rolling their bullish spread bets further out on the curve to the Dec-21/Dec-22 spread (red line below). The expectation is that at some point in the future there will be a bullish short-term event that will impact the front of the market more than the back and cause spreads to rally further OR that we are simply a market that will continue to mature in an environment of increasing production as OPEC+ gradually reduce their output cuts. The rub here is that we are already at historically bullish spread levels so the appetite to layer into new length is low.

Shape of the Curve
The shape of the calendar spread curves highlights the aforementioned high spread levels. The chart on the left depicts one month calendar spreads and the chart on the right depicts 12-month calendar spreads. Each dot on the chart reflects the settle price for that month's spread and the line through them defines the shape of the spread curve.

Three weeks ago, the peak one-month calendar spread was between month-5 vs month-6. As of last Friday's close, the peak one-month calendar spread had been pushed out to month-7 vs month-8 (Nov-21/Dec-21 at the moment). Similarly, year on year 12-month calendar spreads were at their peak in the month-3 vs month-15 spread but as of last Friday's close has been moved back a month (month-4 vs month-16, albeit at a slightly lower level of around $5.20). The bullish sentiment is alive and well, it's just been pushed further out on the curve. At some point we are going to need to see some cash backwardation in order to sustain these spread levels.
Inventory
Inventory levels have been the big story over the last year when refinery throughput ground to a halt along with demand. Looking at the data below, we note that combined crude oil, gasoline and distillate inventory levels in the US have dropped significantly since the peak last year (yellow line, left chart below) but are still above their 5-year average (black line below, left chart). Conversely, as expected, prices are much higher (WTI month-1 futures by year, right chart below). They currently sit about $5.00 above the 2015-2019 5-year average (gold line vs black line, right chart below).
Seasonally we are entering a period of overall declines in inventory from now until Q4. Should this seasonal pattern hold true this year and should inventories dip below the 5-year average, prices could be explosive to the upside.

Location Spreads
One big area of concern last year was the collapse of crude oil location spreads. Midland lost it's premium to WTI as the market collapsed last year but has since recovered and is trading at a premium of about $0.70-$0.80 (gold line and dots below reflect monthly spread futures settlement as of 4/16). It's good to see strength in and around USGC markets.

But, before getting too excited, it's important to note how the spread curve has shifted on a broader basis. The next chart depicts the shift in the spread curve since last October (red line below). Here we see how the spread has weakened since the beginning of the year.

It will be important to watch this going forward since the USGC is not only where a majority of US inventory is stored, but also the area where future US production growth will come from. If the Permian can increase production going forward without the WTI/Midland spread collapsing that will be a positive sign for the health of the market overall.
We now have the spirit of a recovery underpinning markets and a major infrastructure bill on deck. Last Wednesday, President Biden introduced a $2 trillion plan to overhaul and upgrade the nation’s infrastructure, calling it a transformational effort that could create the “most resilient, innovative economy in the world”. It takes energy to build infrastructure.
_________________________________________________________________________________
EIA Inventory Statistics Recap
Weekly Changes
The EIA reported a total petroleum inventory DRAW of 5.90 million barrels for the week ending April 9, 2021 (vs a build of 6.00 million barrels last week)

YTD Changes
Year-to-date total inventories in 2021 are DOWN by 7.00 million barrels (vs 8.60 million last week).

Inventory Levels
Commercial Inventory levels of Crude Oil (ex-SPR) compared to prior years reflect progress that has been made in reducing excess inventory levels.

Comments