
Why the Muted Reaction to the OPEC+ Supply Cuts? Hint: It's Not Because They Weren't Enough.
- bkkelly6
- Apr 12, 2020
- 6 min read
First of all let's acknowledge the astonishing fact that a global majority of producers can collectively agree to remove over 10% of production of a commodity from the market - legally - it should be applauded. This is exactly what transpired after all of the back and forth between OPEC and it's allies last week. An agreement to cut oil production by 9.7 million barrels per day, which is just below the initial proposal floated last week of 10 million bpd.
Of course, OPEC and its allies are hoping that nations outside of the group, including the U.S., Brazil and Canada, will respond in-kind (with as much as 3-4 million barrels per day). But to validate the promise of 'idled' production due to low prices as anything more than "hope and change" is juvenile.
First, let's take a look at the new 2020 supply cut agreement in comparison the the 2017 OPEC+ supply cut agreement that was in effect until March 31, 2020.

The 2017 cuts that expired on March 31, 2020 were credited with helping stop a dramatic multiyear slide in oil prices when first implemented.
OPEC+ supply cuts are based off of agreed upon 'Reference Output' levels. Comparing the 2017 reference levels to those in the new 2020 agreement, note that both Saudi Arabia and Russia are each starting with a reference levels around 400k bpd greater than those in 2017.
Note also in the above table the US crude oil production levels for January, 2017 vs March, 2020 in blue. While OPEC and it's allies cut roughly 2 million barrels per day for over 2 years, US crude oil production increased by roughly 4 million barrels per day, and outright oil prices barely reacted . Therein lies the rub.

Given commercial producers willingness to grow production over the last 3 years in the face of a marketplace that required supply cuts to stay in balance, it's no wonder people are skeptical of the success (not to mention the viability) of these new extreme supply cuts. If they result in any upward pressure on prices, all hopes of economic cuts from non-OPEC+ producers vanish quickly. In that way, it's impossible to believe in the staying power of the OPEC+ agreement that requires Saudi Arabia and Russia to withhold between 1.5-2.5 million barrels per day from the market for over 2 years. This is why the market isn't placing much weight on the proposed timeline. This is a show-me market that will believe it when they see it. No one trusts anyone or any of it.
The "Trust" Factor.
Evidence of why there should be a lack of trust can be seen via commentary from a major US oil producer in 2017.
In November of 2017, the executive chairman of Pioneer Natural Resources Co. (PXD), one of the largest producers in the Permian Basin of Texas and New Mexico, was quoted by Reuters as saying “If producers in the U.S. increase their rig count over the next few months due to higher prices then I expect another price collapse by the end of 2018. I hope that all U.S. shale companies will maintain their current rig counts and use all excess cash flow to increase dividends back to their shareholders”.
Yet, from the end of 2017 to the end of 2018, US rig counts continued to rise as did production...........

All eyes will now be on production numbers out of the US Permian region going forward as it was the hands-down largest contributor to production growth in the last 3 years.

The "Unknown" Factor:
One reason it's difficult to trust the supply cuts outlined above is the uncertainty of the timing of demand recovery. As of the latest EIA inventory report, the refinery capacity utilization rate had fallen to 75.6% for week ending April 3, 2020.
Current assumptions are that once stay-at-home orders are removed and people return to work, gasoline demand will surge and refinery utilization rates will rebound to more normal levels (red line below). However, the scar left on production will linger. Rigs will have been laid idle and the effect of reduced capital expenditures will be laid to bear. This should lead to a gap between refinery demand for oil and actual oil production that can only be closed via inventory draws (difference between projected red line and black line below).
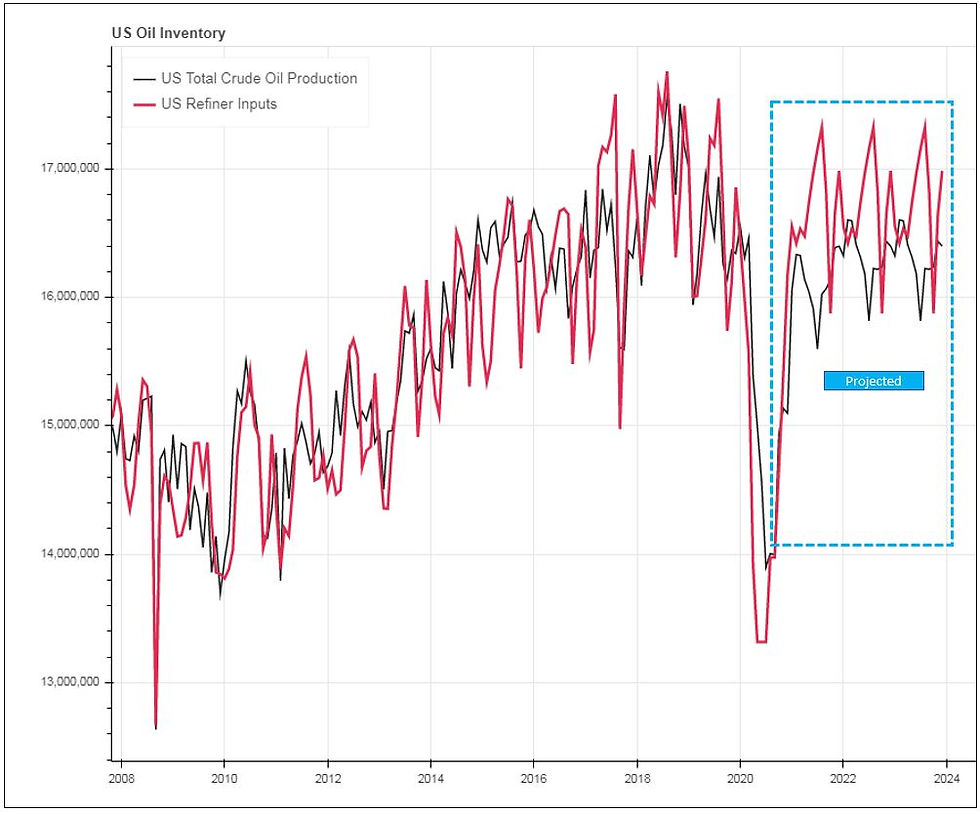
In other words, the length of the OPEC+ production cuts outlined above (which run through the end of 2022) might be designed to mimic the time it will take production losses due to 'market forces' to recover. In that way, the duration of the OPEC+ supply cut agreement might just be clever enough to not only address the severe loss of demand, but also address the time needed to draw down the bloated inventories created by said demand loss.
As great as that sounds, it also highlights the unknown factor - the tenuous nature of future supply/demand imbalances and the competitive reaction of producers if prices stabilize and move higher.
Key Spread Relationships: Then and Now
Keeping both the 2017 and 2020 supply cuts discussed above in mind, it's fair to say that the 2017 cuts preceded supply growing faster than demand and the 2020 cuts precede demand falling faster than supply. Its a slight nuance: the former meant to address supply growth from overwhelming demand growth and the latter meant to address an immediate, catastrophic loss of demand that is expected to harm supply in the long-run.
There are several spread relationships in the oil complex that bounced off of previous lows last week. We merely posit the question as to whether they should they look different this time?
WTI/Brent Spread
The 2017 OPEC+ cuts reduced non-US supply and therefore the WTI/Brent spread widened as Brent is more responsive to non-US supply/demand influences. Will we see a similar widening of the spread with the new 2020 cuts as foreign supply is tightened-up while the US waits around for economic shut-ins to reduce supply?

12-month Calendar Spreads
Last week the WTI 12-month calendar spread futures bounced quickly off of the lows that were made in 2015 when US production was ramping up (but prior to the export ban being lifted and prior to OPEC cuts). Should this spread be wider than 2015 levels given the enormous loss of demand vs the eventual recovery of demand expected in 12 months?

Crude Oil vs NGL's
The growth in US Shale oil production has increased the supply of NGL's due to the growth of production in fields that produce a high volume of natural gas and NGL's have led to a dramatic weakness in NGL pricing relative to oil. Looking at the spread between month-1 crude oil vs the month-1 NGL composite price, the relative weakness of NGL's since 2019 is shocking.

Bottom-line, there is so much about current market dynamics that are not remotely comparable to prior events, yet markets are attempting to find value as if they were.
Inventory Recap
US inventory levels vs total storage capacity:

Weekly Stats
The EIA reported a total inventory BUILD of 26.10 million barrels for the week ending April 2, 2020.

Year-to-date, this bring us to a Total Inventory BUILD of a whopping 42.60 million barrels!

Inventory levels are shown below, compared to prior year levels for the same week ending as well as against total storage capacity.

Lee Taylor - Technical Levels
BRENT
Resistance: 34.27 / 35.95 / 39.70
Support: 31.18 / 28.17 / 24.52
On a daily basis, the Brent market doesn’t seem to be as oversold as WTI. The Brent market is developing solid support underneath. Daily lows from last week, coupled with highs from the prior week, makes it technically sounder than WTI. Keep a close eye on our support numbers if the market doesn’t have faith in the announced cuts. The major gap in the Brent market lays above from 39.70 - 45.18 basis the weekly chart. Look for support in June/Dec Brent at -7.18 with resistance at -6.19. If it falls through the -7.18 level look for a move back to -8.16.
WTI
Resistance: 23.74 / 27.34 / 29.13
Support: 22.57 / 21.89 / 19.27
There have been so many tweets, headlines, stories and rumors this past week that it is apparent that we need to focus on support and resistance. Although there is an enormous gap above the WTI market from 36.35-41.05 on the weekly chart, there is plenty of work to do before that comes into play. The market does feel heavy at the moment as the Saudi/Russian/G20 agreement didn’t live up to expectations and when announced caused the market to trade off. Major resistance at -4.30 in May/June WTI.
RBOB
Resistance: .7138 / .7600 / .8536
Support: .6350 / .5809 / .5090
RBOB has major resistance above the market which won’t be easy to penetrate. The market has been slowly grinding higher, but our feeling is the retreat will be rapid. May/June seemed primed to make new contract lows but was able to cut through resistance above at -680. Look for a retest of that level.
HEATING OIL
Resistance: 1.0525 / 1.0864 / 1.1384
Support: .9636 / .9430 / .9303
From a daily perspective, heating oil is beginning to build a base. Look for our support numbers to be tested early and often this week. The front end of the heating oil curve has been sold off hard. I don’t envision a smart play on the June/July spread. Selling an oversold structure rarely pays off, however, there is more data with some spreads out in the curve. Dec/Jan is right in the middle of the range between -103 down to -200. Look at a tighter range of -115 down to -160.
Comments